Newsletter Subscribe
Enter your email address below and subscribe to our newsletter
Enter your email address below and subscribe to our newsletter
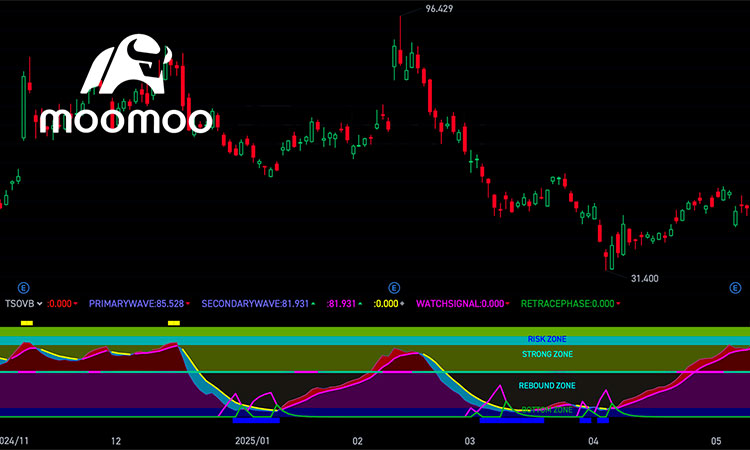
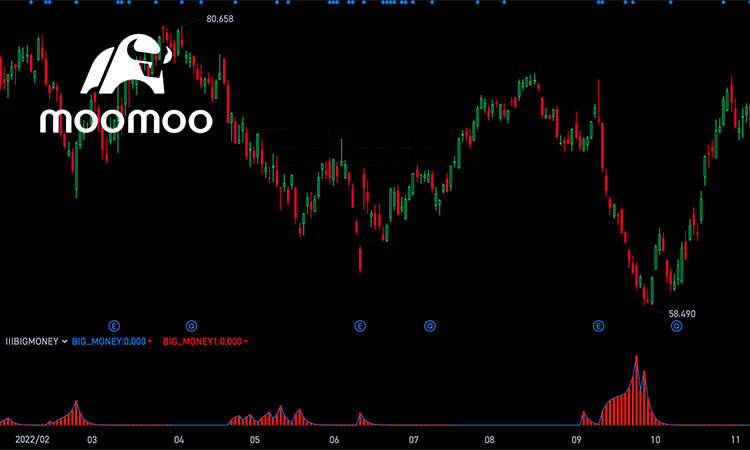
This is an indicator of Moomoo trading software.
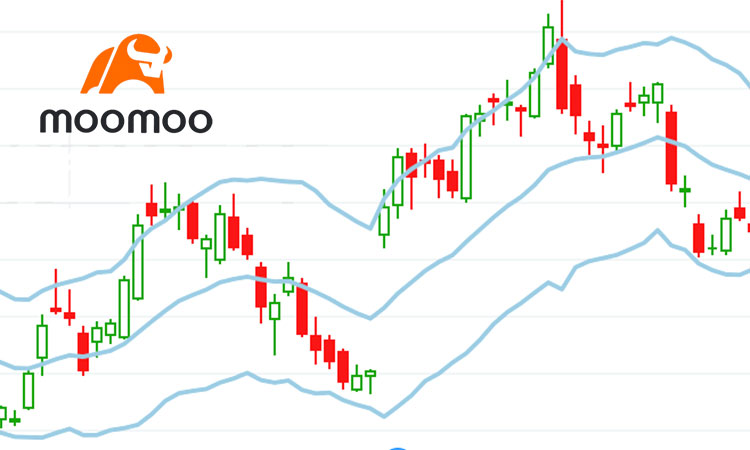
This volatility-based indicator uses EMA + ATR bands to track trends and reversals:
| Scenario | Signal | Action |
|---|---|---|
| Trend strengthening | Price breaks through the upper track (UB) and maintains | Go long/hold when price breaks above UB |
| Trend reversal | Price falls below the lower track (LB) and then returns to the channel | Take profit if price re-enters channel from below |
| Range oscillation | Price repeatedly touches UB/LB in the channel | Trade reversals at UB/LB with caution |
| Channel narrowing | The distance between UB and LB continues to narrow | Prepare for volatility surge |
① Dynamic: ATR adapts to changing volatility
② Versatile: Works in trends and ranges
③ Visual: Cleanly marks support/resistance levels
In trends: Follow the breakout direction
In ranges: Use RSI/MACD to filter false signals
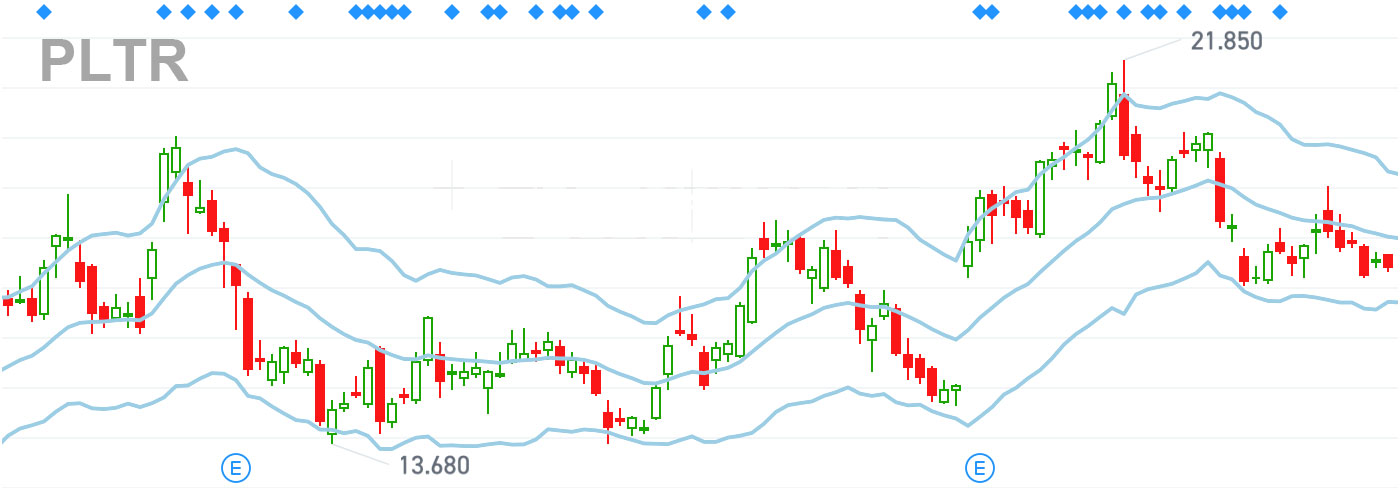
Learn to verify the power of this indicator through the historical K-line indicator charts of the following two stocks PLTR and CLS.
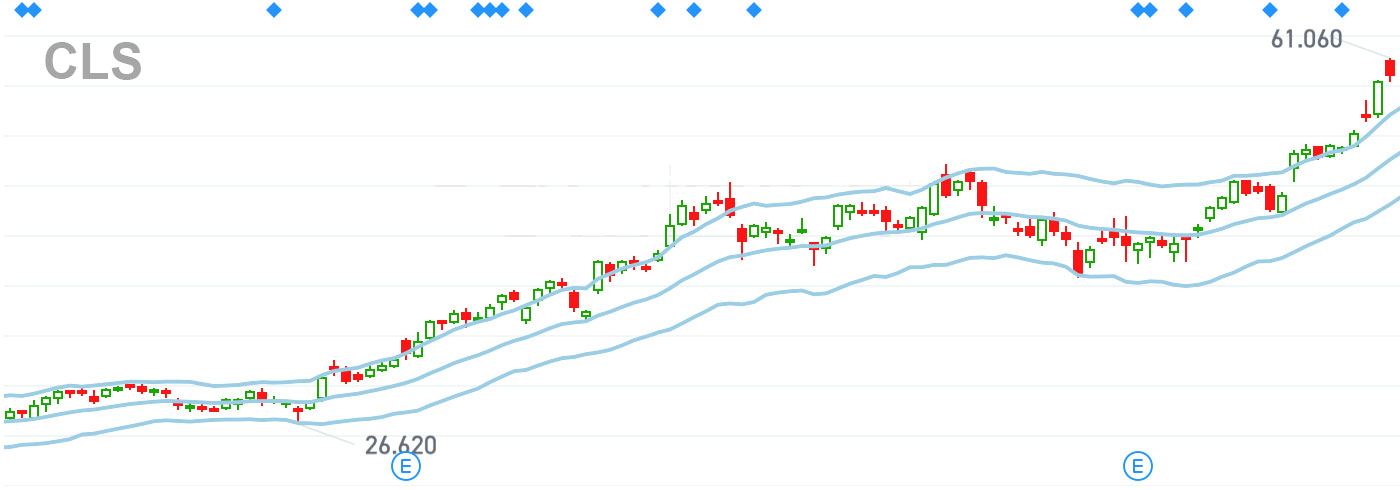
ML:EMA(CLOSE,20),COLOR96C3D9,LINETHICK2;
TR1:=MAX(MAX((HIGH-LOW),ABS(REF(CLOSE,1)-HIGH)),ABS(REF(CLOSE,1)-LOW));
ATR1:=MA(TR1,14);
UB:ML+2*ATR1,COLOR96C3D9,LINETHICK2;
LB:ML-2*ATR1,COLOR96C3D9,LINETHICK2;