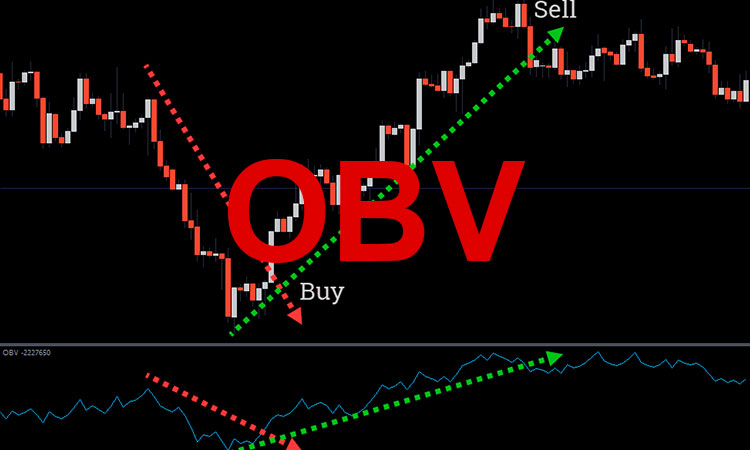
On‑Balance Volume (OBV) uniquely combines price and volume to track buying and selling pressure over time. Developed by Joseph Granville in 1963, OBV adds volume on up days and subtracts on down days to form a cumulative line indicating market sentiment. Its absolute values are less relevant than its direction and slope changes, which help confirm trends or warn of reversals.
What Is OBV?
OBV Today = OBV Yesterday + Volume (if Close > Prev Close) – Volume (if Close < Prev Close) + 0 (if Close = Prev Close)
Core Uses
- Trend Confirmation: Price highs matched by OBV highs confirm strong buying pressure; discrepancies signal potential trend weakness.
- Reversal Warning: In downtrends, rising OBV against falling prices (positive divergence) often indicates accumulation.
- Breakout Validation: A breakout validated by a surge in OBV suggests genuine strength; lack of volume follow‑through warns of false breakouts.
Practical Strategies
- Divergence Strategy: Trade negative or positive OBV divergences against price extremes, using support/resistance for stops.
- Breakout Follow‑Through: Enter on OBV‑confirmed breakouts and trail stops on pullbacks to OBV or trendline support.
Tips & Cautions
- Combine Indicators: Use OBV with moving averages or RSI for better reliability.
- Beware Choppy Markets: Low‑volume environments reduce OBV signal quality.
- Focus on Slope: OBV slope changes often precede single‑point divergences.
- Multi‑Timeframe Confirmation: Check OBV trends on daily and intraday charts to filter noise.
Ride the volume wave with OBV to gain early insights into market sentiment and make more informed trading decisions. Good luck!