Newsletter Subscribe
Enter your email address below and subscribe to our newsletter
Enter your email address below and subscribe to our newsletter
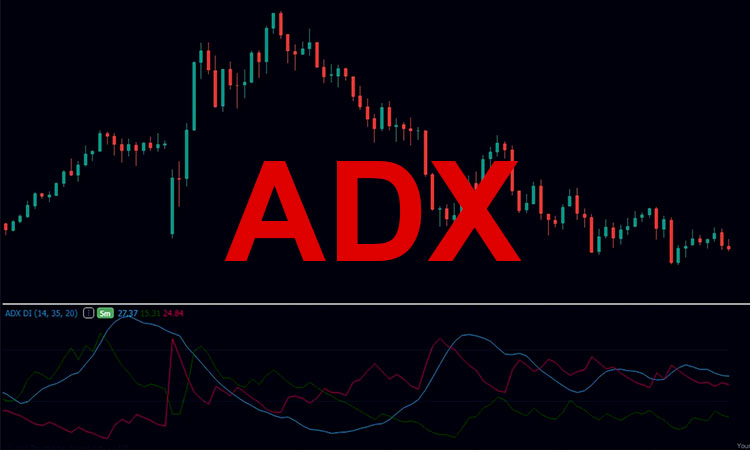
The Average Directional Index (ADX) measures trend strength without indicating direction. Values above 25 suggest a significant trend, while above 40 indicate a very strong trend. Traders can use ADX to identify when to “trade with the trend” and when to “avoid ranging markets.”
Developed by J. Welles Wilder Jr. in 1978, the Average Directional Index (ADX) quantifies trend strength rather than direction. ADX is calculated from the positive (+DI) and negative (–DI) directional indicators and the True Range (TR), then smoothed and scaled to 0–100.
Volume Confirmation: Volume-supported breakouts are more reliable.
Combine Indicators: Use RSI or MACD to refine entry when ADX > 20.
Multiple Timeframes: Confirm ADX trends on both daily and hourly charts.
Period Adjustment: Default 14; use 7 for short-term, 20 for long-term.
Be Patient: ADX is lagging—avoid premature exits.