Newsletter Subscribe
Enter your email address below and subscribe to our newsletter
Enter your email address below and subscribe to our newsletter
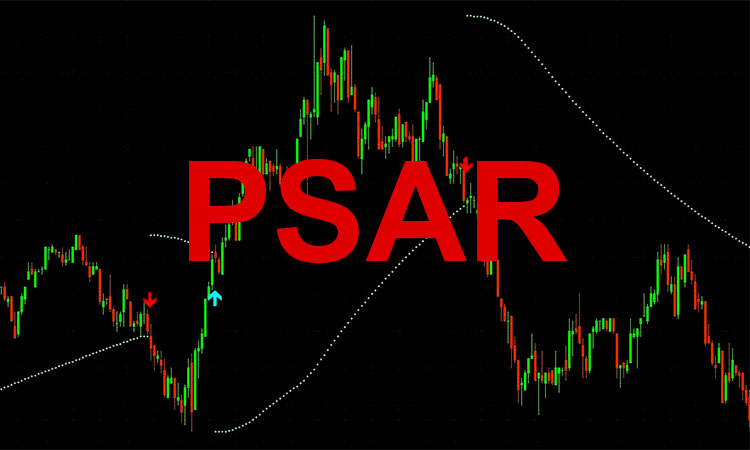
The Parabolic SAR (PSAR) is a trend-following stop-and-reverse system developed by J. Welles Wilder Jr. in 1978. It plots dots above or below price bars to signal trend direction and potential reversals. PSAR works best in clear trending markets, helping traders identify entries and trailing stops, but it can generate false signals in ranging markets. Two practical strategies—trend-following and trailing stop—are presented, along with key usage tips to apply PSAR effectively.
Parabolic SAR, or “stop and reverse,” appears as dots above or below price bars. Dots below price indicate an uptrend; dots above signal a downtrend or potential reversal.
Use only in trending markets; avoid in choppy ranges.
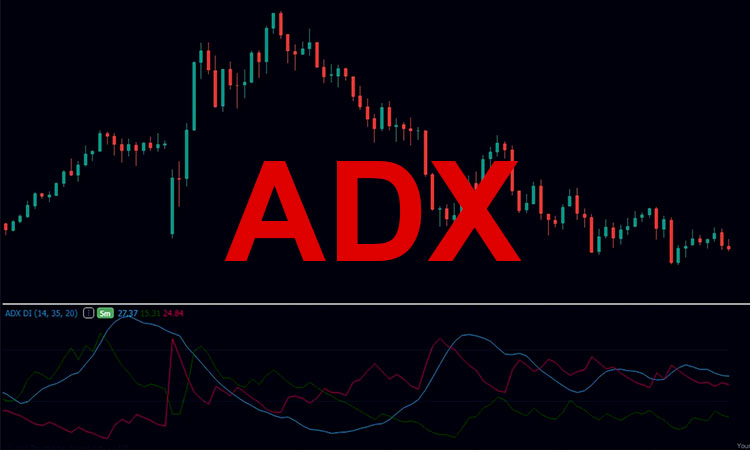
Combine with ADX or moving averages to confirm trend.
Adjust AF for desired sensitivity (short-term vs. long-term).
Validate signals across multiple timeframes (daily, 4H, 1H).
Watch volume for confirmation of trend continuation.