Newsletter Subscribe
Enter your email address below and subscribe to our newsletter
Enter your email address below and subscribe to our newsletter
This is an indicator of Moomoo trading software.
This indicator combines multi-period EMAs (4/6/10/15 days) with a 20-day MA to build a dynamic price channel:
Core Logic: Uses multi-EMA smoothing to reduce noise, paired with 20-day MA to filter false breaks and identify high-probability trend transitions.
| Component | Formula | Function |
|---|---|---|
| Multi-period EMA average | VAR5=(EMA4+EMA6+EMA10+EMA15)/4 | Smooths price noise by averaging EMAs |
| Dynamic Channel | DRAWBAND(AVG_EMA, BOUND) | Visualizes bullish/bearish zones |
| Signal trigger | CROSS(AVG_EMA, BOUND) | Objective signals without manual analysis |
① Stable: Multi-EMA reduces whipsaws vs single MA
② Visual: Color zones simplify trend strength analysis
③ Beginner-friendly: Arrows provide clear actions
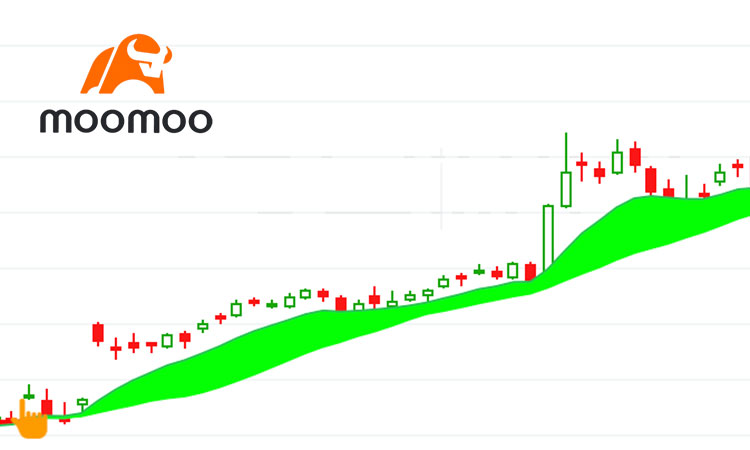
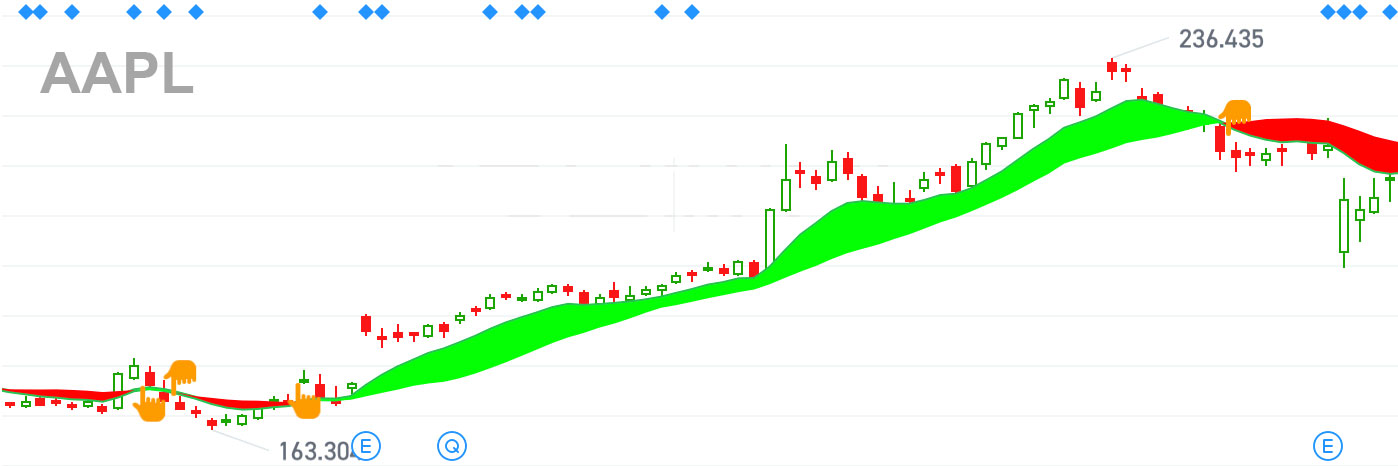
When the band is red, it is a downward trend, and green is an upward trend. When the 👆 symbol appears, you can open a position and set a stop loss; the appearance of the 👇 symbol is a sell signal.
Below are two historical K-lines of Apple and Google. Combining indicators can easily enter and exit the market.

VAR1:=EMA(CLOSE,4);
VAR2:=EMA(CLOSE,6);
VAR3:=EMA(CLOSE,10);
VAR4:=EMA(CLOSE,15);
VAR5:=(VAR1+VAR2+VAR3+VAR4)/4;

AVG_EMA:EMA(VAR5,2),LINETHICK2,COLORGREEN;
BOUND:=MA(CLOSE,20);

DRAWBAND(AVG_EMA,RGB(0,255,0),BOUND,RGB(255,0,0));

COND1:=CROSS(AVG_EMA,BOUND);
COND2:=CROSS(BOUND,AVG_EMA);
DRAWICON(COND1,L*0.98,11);
DRAWICON(COND2,H*1.02,12);