Newsletter Subscribe
Enter your email address below and subscribe to our newsletter
Enter your email address below and subscribe to our newsletter
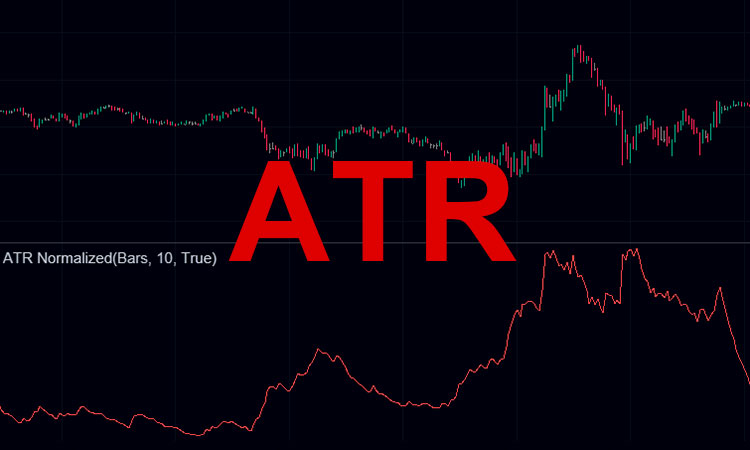
This article explains what ATR is, how to calculate and interpret it, plus two practical trading strategies and key cautions. ATR helps traders gauge market volatility, set adaptive stops, and size positions intelligently.
The Average True Range (ATR) is a volatility indicator developed by J. Welles Wilder Jr. in 1978, reflecting price movement magnitude without indicating direction.
ATR is the moving average (typically 14 periods) of the True Range (TR), which is the maximum of: high–low, |high–prevClose|, |low–prevClose|.
1. Volatility Breakout
2. Dynamic Stop-Loss
Don’t trade ATR alone: ATR measures magnitude, not direction. Must combine with price action.
Optimize periods: 7–10 for short-term, 20–50 for long-term.
Combine indicators: Pair with ADX or moving averages for trend confirmation.
Multi-timeframe use: ATR applies to intraday, daily, weekly charts—interpret per context.