Newsletter Subscribe
Enter your email address below and subscribe to our newsletter
Enter your email address below and subscribe to our newsletter

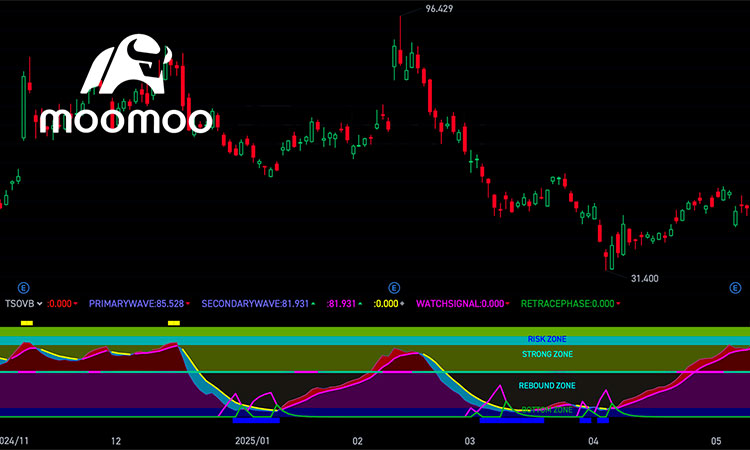
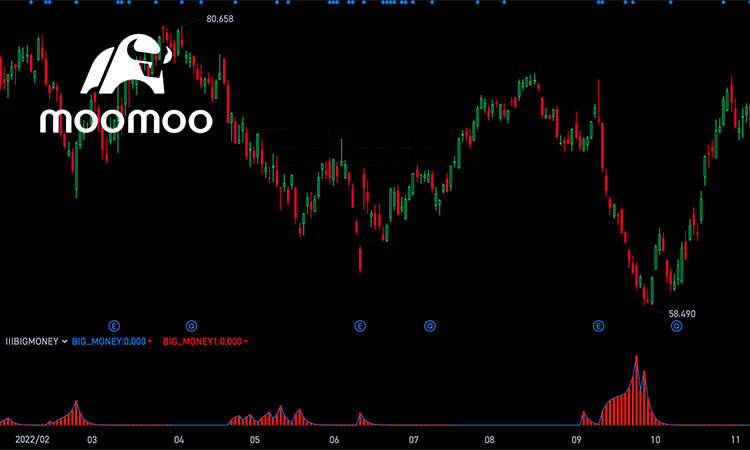
This is an indicator of Moomoo trading software.
This indicator integrates MACD trend momentum, KDJ overbought/oversold signals, and volume filtering to visually highlight 4 market phases:
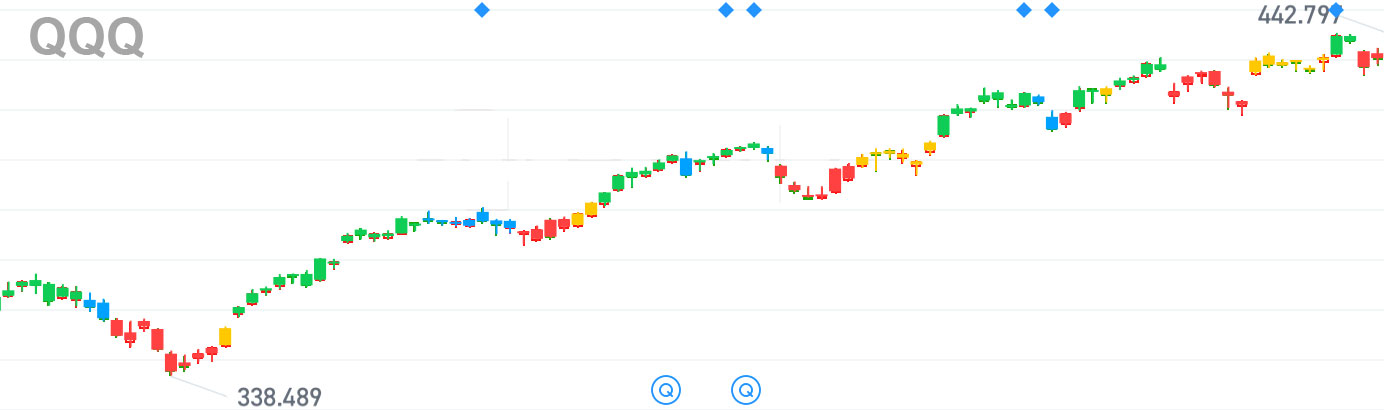
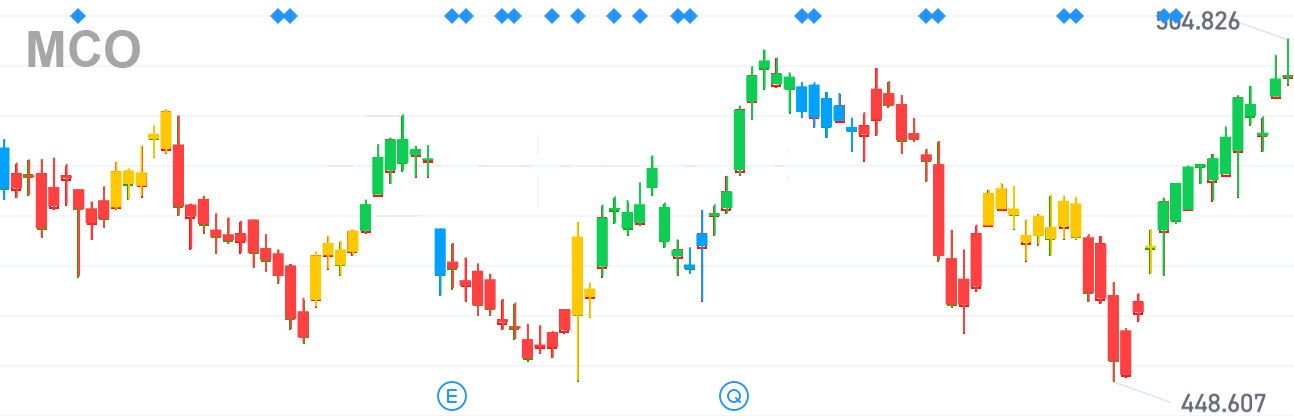
We can open a position when the bar chart turns yellow, set a stop loss price according to our tolerance, increase the position when the bar chart turns green, reduce the position when the bar chart turns blue, and clear the position when it turns red.
The figure below is the historical K-line of QQQ and MCO. We can clearly see that the indicator captures the trend changes most of the time and expresses it intuitively through four colors.
RSV:=(CLOSE-LLV(LOW,14))/(HHV(HIGH,14)-LLV(LOW,14))100;
K:=SMA(RSV,3,1);
D:=SMA(K,3,1);
DIFF:= EMA(CLOSE,12)- EMA(CLOSE,26);
DEA :=EMA(DIFF,9);
MACD:=2(DIFF-DEA);

MinorSignal:IF(MACD<0 AND K>D AND V>1,-1,0),COLORFFBF00,NODRAW;
StrongSignal:IF(K>D AND MACD>0 AND V>1,2,0),COLOR0FC351,NODRAW;
OscillatorSignal:IF(MACD>0 AND K1,1,0),COLOR0099FF,NODRAW;
WeakSignal:IF(K1,-2,0),COLORRED,NODRAW;

STICKLINE(MinorSignal,L,H,0.1,0),COLORFFBF00;
STICKLINE(MinorSignal AND C>=O,C,O,0.9,0),COLORFFBF00;
STICKLINE(MinorSignal AND C<O,C,O,0.9,0),COLORFFBF00;

STICKLINE(StrongSignal,L,H,0.1,0),COLOR0FC351;
STICKLINE(StrongSignal AND C>=O,C,O,0.9,0),COLOR0FC351;
STICKLINE(StrongSignal AND C<O,C,O,0.9,0),COLOR0FC351;

STICKLINE(OscillatorSignal,L,H,0.1,0),COLOR0099FF;
STICKLINE(OscillatorSignal AND C>=O,C,O,0.9,0),COLOR0099FF;
STICKLINE(OscillatorSignal AND C<O,C,O,0.9,0),COLOR0099FF;

STICKLINE(WeakSignal,L,H,0.1,0),COLORRED;
STICKLINE(WeakSignal AND C>=O,C,O,0.9,0),COLORRED;
STICKLINE(WeakSignal AND C<O,C,O,0.9,0),COLORRED;