Newsletter Subscribe
Enter your email address below and subscribe to our newsletter
Enter your email address below and subscribe to our newsletter
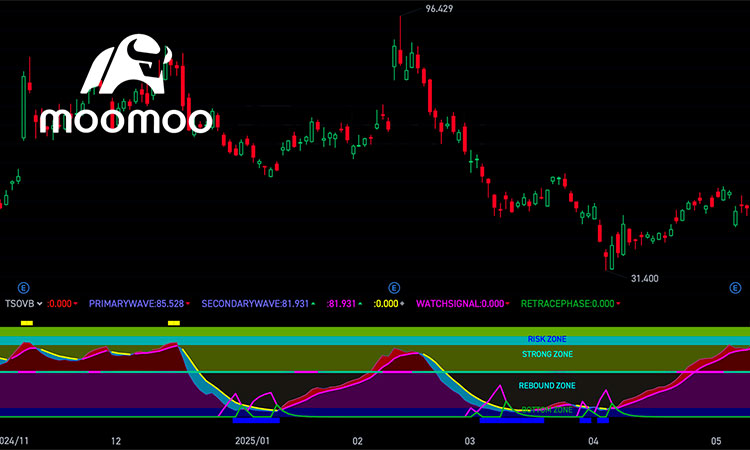
This is an indicator of Moomoo trading software.
Combines price channels, KDJ bottom signals, and RSI overbought alerts for swing trading:
Best Used In: Clear trends or range-bound markets; avoid during sideways consolidation.
| Signal | Trigger | Action |
|---|---|---|
| Reduce | HH1 > LL1 | Take partial profits |
| Add | LL1 > HH1 | Scale into positions |
| Buy | KDJ-J line breaks through 10 | Enter long cautiously |
| Sell | RSI ≥ 80 and turns downward | Exit overbought positions |
Swing Trade: Act within 3-5 days after signals
Priority: Always respect RSI “Sell” signals first
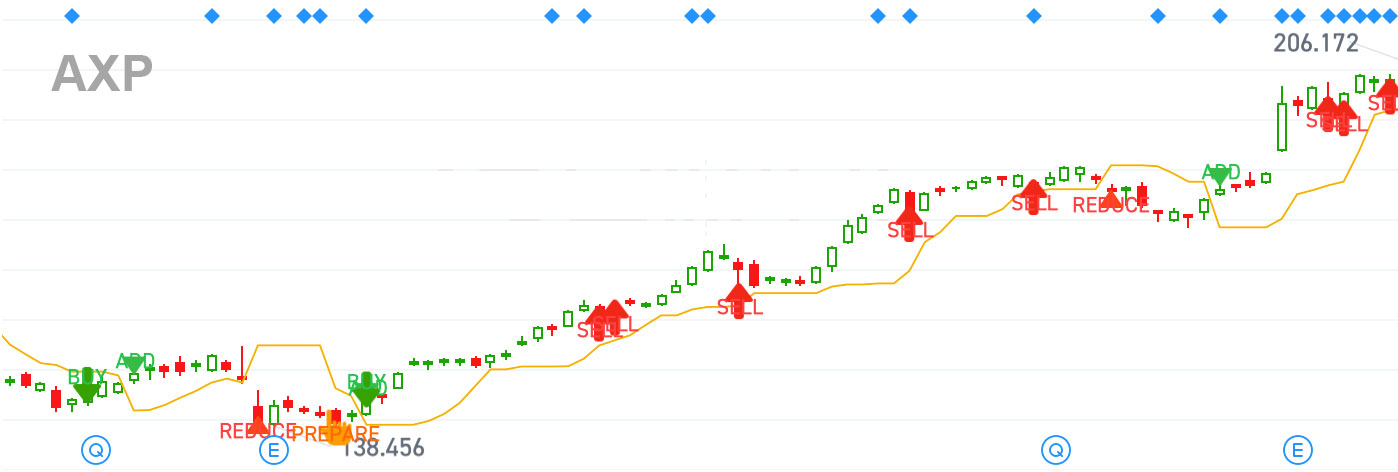
The following two figures are the historical K-lines of the combined indicators of UXP and ULTA. We can refer to the tips given by the indicators to operate. When the price is above the trend line, it represents an upward trend. At this time, buy according to the indicator and set a stop loss. The profit-loss ratio is still quite high.

N := 6;
HH := HHV(HIGH, N);
LL := LLV(LOW, N);
HH1 := BARSLAST(HH > REF(HH, 1));
LL1 := BARSLAST(LL < REF(LL, 1));
FLAG := IF(HH1 < LL1, 1, IF(HH1 > LL1, -1, 0));
IF(FLAG >= 0, LL, HH), COLORYELLOW, LINETHICK1;

DRAWICON(CROSS(HH1, LL1), LOW - 0.5, 38);
DRAWTEXT(CROSS(HH1, LL1), LOW - 1.5, 'REDUCE'), COLORRED;
DRAWICON(CROSS(LL1, HH1), HIGH + 0.5, 39);
DRAWTEXT(CROSS(LL1, HH1), HIGH + 1.5, 'ADD'), COLORGREEN;

RSV := (CLOSE - LLV(LOW, 27)) / (HHV(HIGH, 27) - LLV(LOW, 27)) * 100;
K := SMA(RSV, 5, 1);
D := SMA(K, 3, 1);
J := 3 * K - 2 * D;

DRAWICON(CROSS(J, 10), HIGH + 1, 2);
DRAWTEXT(CROSS(J, 10), HIGH + 2.5, 'BUY'), COLORGREEN;
DRAWICON(IF(CROSS(10, J), 1, 0), LOW - 0.5, 11);
DRAWTEXT(IF(CROSS(10, J), 1, 0), LOW - 1.5, 'PREPARE'), COLORORANGE;

LC := REF(CLOSE, 2);
RSI := SMA(MAX(CLOSE - LC, 0), 7, 1) / SMA(ABS(CLOSE - LC), 7, 1) * 100;
SELL := RSI <= REF(RSI, 1) AND RSI >= 80;
DRAWICON(SELL, LOW - 1.5, 1);
DRAWTEXT(SELL, LOW - 2.5, 'SELL'), COLORRED;