Newsletter Subscribe
Enter your email address below and subscribe to our newsletter
Enter your email address below and subscribe to our newsletter
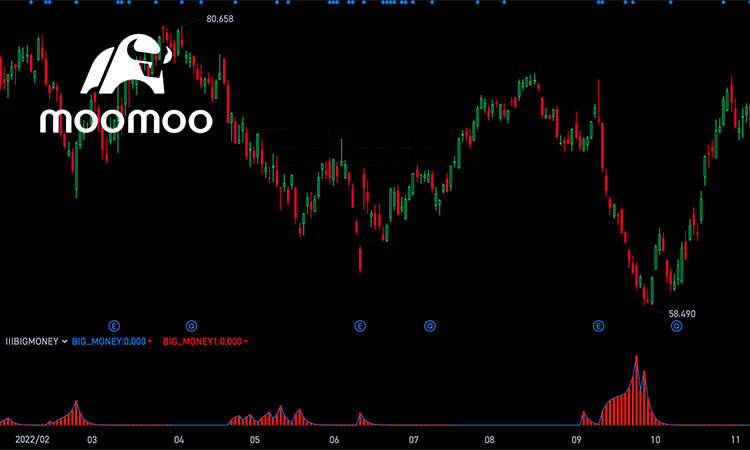
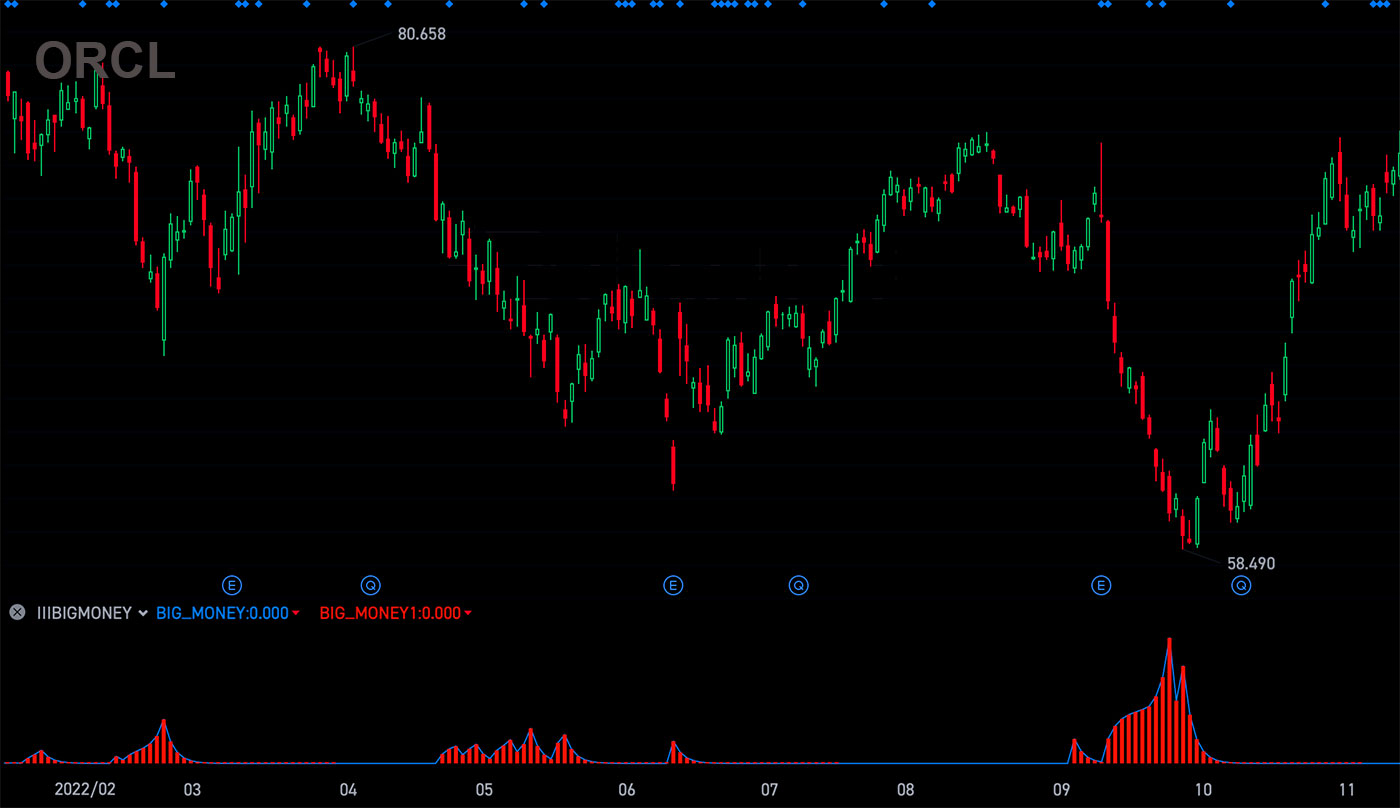
The BIG MONEY Indicator is a custom technical tool designed to detect smart money inflows, i.e., when institutional or large investors quietly accumulate shares at low prices.
It uses a combination of long-term high/low price levels, volatility, and current price position to evaluate whether a stock is being accumulated during a bottoming phase.
| Variable | Description |
|---|---|
VARA | A dynamic price ceiling used to detect abnormally low prices |
VARD | Measures current volatility intensity |
BIG_MONEY | Raw detection of smart money signals |
BIG_MONEY1 | Filtered output showing only strong signals (usually shown as thick red bars) |
When you see thick red bars on the chart:
This is often a good buy-on-dip signal, especially for swing traders.
| Indicator | Role |
|---|---|
| Moving Averages (MA20, MA60) | Confirm the overall trend direction |
| MACD, KDJ, RSI | Confirm oversold or bullish divergence |
| Volume | Volume spike with red bar = stronger signal |
Red bars shine, big money signs. Buy the dip, let profits climb.
VAR1:=EMA(HHV(HIGH,500),21);
VAR2:=EMA(HHV(HIGH,250),21);
VAR3:=EMA(HHV(HIGH,90),21);
VAR4:=EMA(LLV(LOW,500),21);
VAR5:=EMA(LLV(LOW,250),21);
VAR6:=EMA(LLV(LOW,90),21);

VAR7:=EMA((VAR4*0.96+VAR5*0.96+VAR6*0.96+VAR1*0.558+VAR2*0.558+VAR3*0.558)/6,21);
VAR8:=EMA((VAR4*1.25+VAR5*1.23+VAR6*1.2+VAR1*0.55+VAR2*0.55+VAR3*0.65)/6,21);
VAR9:=EMA((VAR4*1.3+VAR5*1.3+VAR6*1.3+VAR1*0.68+VAR2*0.68+VAR3*0.68)/6,21);

VARA:=EMA((VAR7*3+VAR8*2+VAR9)/6*1.738,21);
VARB:=REF(LOW,1);
VARC:=SMA(ABS(LOW-VARB),3,1)/SMA(MAX(LOW-VARB,0),3,1)*100;
VARD:=EMA(IF(CLOSE*1.35<=VARA,VARC*10,VARC/10),3);
VARE:=LLV(LOW,30);
VARF:=HHV(VARD,30);

BIG_MONEY:EMA(IF(LOW<=VARE,(VARD+VARF*2)/2,0),3)/618,COLORBLUE;
BIG_MONEY1:IF(BIG_MONEY>0,BIG_MONEY,0),STICK,LINETHICK5,COLORRED;