Newsletter Subscribe
Enter your email address below and subscribe to our newsletter
Enter your email address below and subscribe to our newsletter
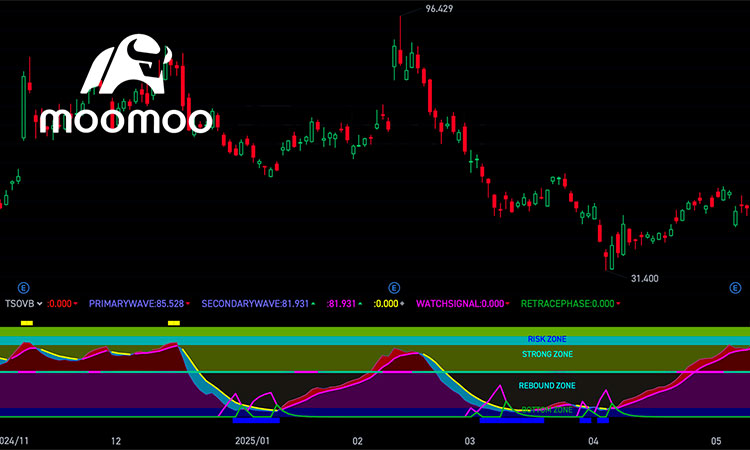
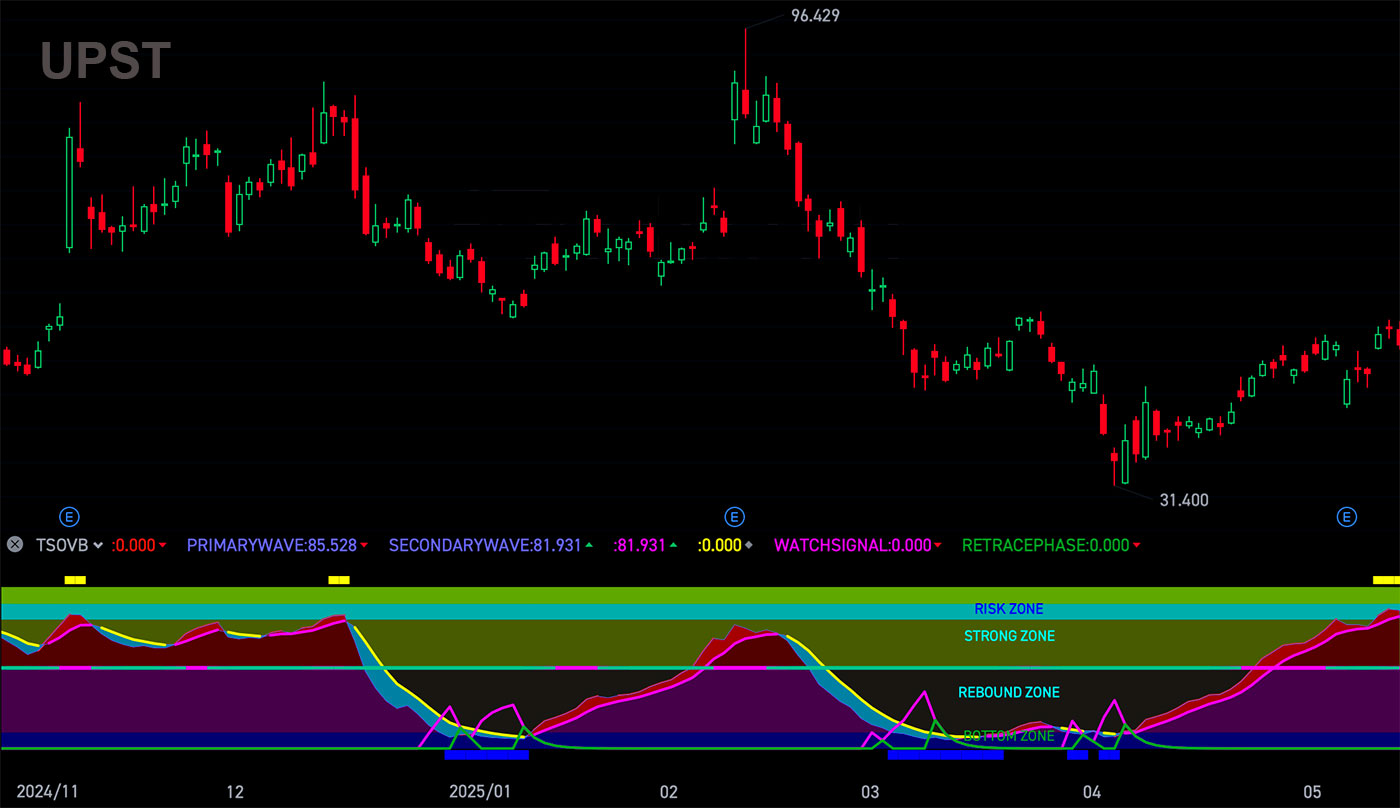
Tip: Combine with price action – look for confirmation when both TSOVB signals and actual breakouts/down occur simultaneously. The indicator works best on daily/weekly charts for swing trading.
STICKLINE(CLOSE>0,0,10,5,0),COLOR00008A;
STICKLINE(CLOSE>0,10,50,5,0),COLOR63006A;
STICKLINE(CLOSE>0,50,80,5,0),COLOR657600;
STICKLINE(CLOSE>0,80,90,5,0),COLOR00BBBB;
STICKLINE(CLOSE>0,90,100,5,0),COLOR79B715;

MAINTREND := SMA(((CLOSE-LLV(LOW,28))/(HHV(HIGH,28)-LLV(LOW,28))*100),3,1);
DRAWBAND(MAINTREND,RGB(110,0,20),50,RGB(60,60,60));
IF(MAINTREND>REF(MAINTREND,1),MAINTREND,DRAWNULL),COLORRED,LINETHICK2;
SIGNALLINE := SMA(MAINTREND,3,1);
PRIMARYWAVE: MAINTREND;
SECONDARYWAVE: SIGNALLINE;
DRAWBAND(PRIMARYWAVE,RGB(180,0,0),SECONDARYWAVE,RGB(0,150,180));
IF(MAINTREND>SIGNALLINE,SIGNALLINE,DRAWNULL),COLORFF00FF,LINETHICK2;
IF(MAINTREND<SIGNALLINE,SIGNALLINE,DRAWNULL),COLORFFFF00,LINETHICK2;

RSV := (CLOSE-LLV(CLOSE,9))/(HHV(CLOSE,9)-LLV(CLOSE,9))*100;
K := SMA(RSV,3,1);
D := SMA(K,3,1);
TYP := (HIGH+LOW+CLOSE)/3;
CCI := (TYP-MA(TYP,14))/(0.015*AVEDEV(TYP,14));
DIFF := EMA(CLOSE,2)-EMA(CLOSE,55);
DEA := EMA(DIFF,6);
MACD := 2*(DIFF-DEA);
TURNINGPOINT := IF(K>D AND CCI>0 AND DIFF>DEA AND MACD>0,1,0);
STICKLINE(TURNINGPOINT=1,49,51,4,0),COLORFF00FF;
STICKLINE(TURNINGPOINT=0,49,51,4,0),COLORCYAN;

VR2 := REF(LOW,1);
VR3 := SMA(ABS(LOW-VR2),3,1)/SMA(MAX(LOW-VR2,0),3,1)*100;
VR4 := EMA(IF(CLOSE*1.3,VR3*10,VR3/10),3);
VR5 := LLV(LOW,30);
VR6 := HHV(VR4,30);
VR7 := IF(MA(CLOSE,58),1,0);
VR8 := EMA(IF(LOW<=VR5,(VR4+VR6*2)/2,0),3)/618*VR7;
VR9 := IF(VR8>100,100,VR8);
WATCHSIGNAL: IF(VR9>-150,VR9,0),COLORFF00FF,LINETHICK2;
RETRACEPHASE: IF(VR9<REF(VR9,1),VR9,0),COLORGREEN,LINETHICK2;

STICKLINE(MAINTREND>=90,102,112,1,0),COLOR00FFFF;
STICKLINE(MAINTREND>=80,102,107,1,0),COLORFFFF00;
STICKLINE(MAINTREND<=10,-1,-7,1,0),COLOR0000FF;
STICKLINE(CLOSE>0,90,90,2,0),COLORDDDDDD;
STICKLINE(CLOSE>0,80,80,2,0),COLORDDDDDD;
STICKLINE(CLOSE>0,10,10,2,0),COLOR00DDDD;

DRAWTEXT(CURRBARSCOUNT=38,8,'BOTTOM ZONE'),COLORGREEN;
DRAWTEXT(CURRBARSCOUNT=38,35,'REBOUND ZONE'),COLOR00FFFF;
DRAWTEXT(CURRBARSCOUNT=38,70,'STRONG ZONE'),COLOR00FFFF;
DRAWTEXT(CURRBARSCOUNT=38,87,'RISK ZONE'),COLOR0000FF;