
Newsletter Subscribe
Enter your email address below and subscribe to our newsletter
Enter your email address below and subscribe to our newsletter


Trade Setup In mid-2020, I noticed that AMZN was experiencing a significant increase in demand for its cloud computing services, driven by the COVID-19 pandemic. The company’s revenue and earnings were consistently beating analyst estimates, and I believed its stock…
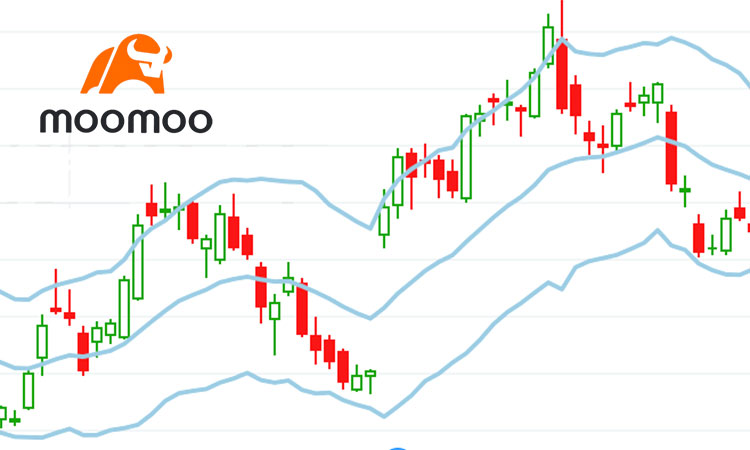
This is an indicator of Moomoo trading software. Combines price channels, KDJ bottom signals, and RSI overbought alerts for swing trading: Best Used In: Clear trends or range-bound markets; avoid during sideways consolidation. Signal Logic Signal Trigger Action Reduce HH1 > LL1…

This is an indicator of Moomoo trading software. This indicator integrates MACD trend momentum, KDJ overbought/oversold signals, and volume filtering to visually highlight 4 market phases: Operation instructions We can open a position when the bar chart turns yellow, set…

As a seasoned stock trader, I’d like to share with you a real-life example of a successful trade I made on Apple Inc. (AAPL) in 2020. This trade demonstrates a combination of technical analysis, risk management, and patience. Trade Setup…
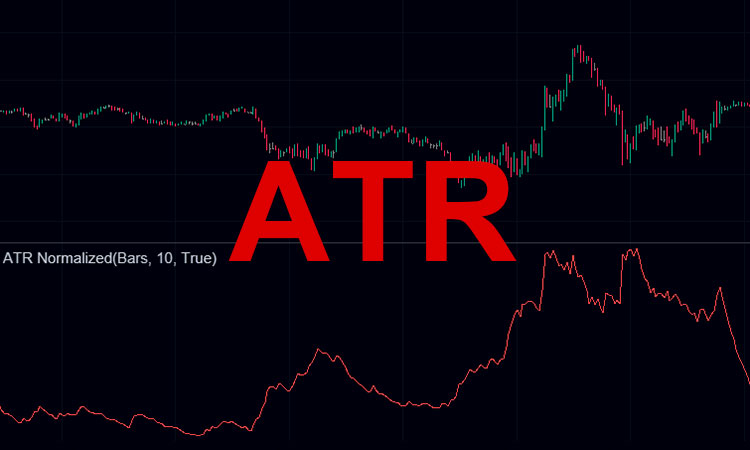
Summary This article explains what ATR is, how to calculate and interpret it, plus two practical trading strategies and key cautions. ATR helps traders gauge market volatility, set adaptive stops, and size positions intelligently. What Is ATR? The Average True…
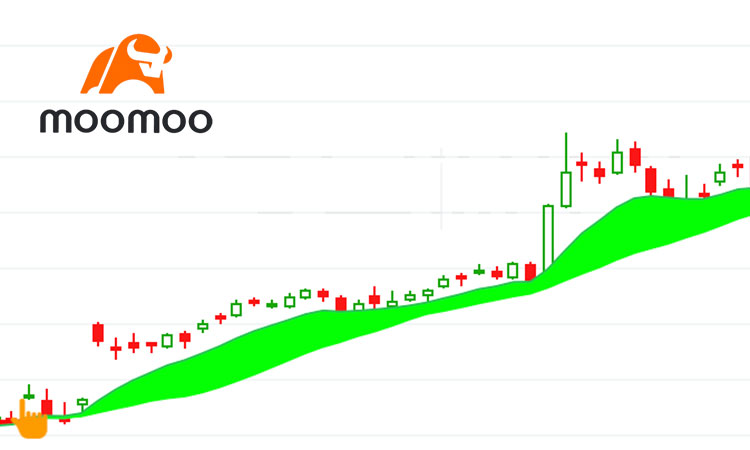
This is an indicator of Moomoo trading software. This volatility-based indicator uses EMA + ATR bands to track trends and reversals: Trading Rules Scenario Signal Action Trend strengthening Price breaks through the upper track (UB) and maintains Go long/hold when price breaks…
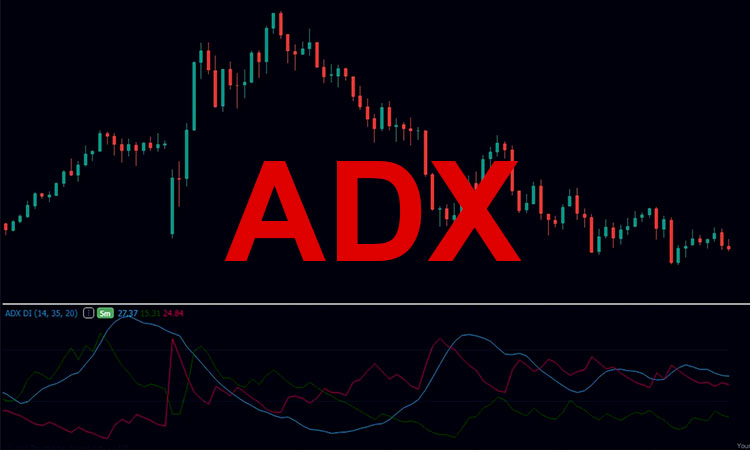
Summary The Average Directional Index (ADX) measures trend strength without indicating direction. Values above 25 suggest a significant trend, while above 40 indicate a very strong trend. Traders can use ADX to identify when to “trade with the trend” and…

As a seasoned stock trader, I’d like to share with you a real-life example of a successful trade I made on Tesla, Inc. (TSLA) in 2020. This trade demonstrates a combination of technical analysis and risk management. Trade Setup In…
This is an indicator of Moomoo trading software. This indicator combines multi-period EMAs (4/6/10/15 days) with a 20-day MA to build a dynamic price channel: Core Logic: Uses multi-EMA smoothing to reduce noise, paired with 20-day MA to filter false…
1. What is RSI? The Relative Strength Index (RSI) is a momentum oscillator that measures the speed and change of price movements. Its values range from 0 to 100, typically used to identify overbought and oversold conditions. Default RSI Setting:…