
Newsletter Subscribe
Enter your email address below and subscribe to our newsletter
Enter your email address below and subscribe to our newsletter
1. What is the CCI Indicator? The Commodity Channel Index (CCI) is a versatile technical indicator that measures the difference between the current price and its historical average. Though originally designed for commodities, it works well in stocks, indices, and…
Summary This article explains what ATR is, how to calculate and interpret it, plus two practical trading strategies and key cautions. ATR helps traders gauge market volatility, set adaptive stops, and size positions intelligently. What Is ATR? The Average True…
Summary The Average Directional Index (ADX) measures trend strength without indicating direction. Values above 25 suggest a significant trend, while above 40 indicate a very strong trend. Traders can use ADX to identify when to “trade with the trend” and…
1. What is RSI? The Relative Strength Index (RSI) is a momentum oscillator that measures the speed and change of price movements. Its values range from 0 to 100, typically used to identify overbought and oversold conditions. Default RSI Setting:…
1. What is a Moving Average? A moving average (MA) is one of the most popular tools in technical analysis. It smooths out price data by creating a constantly updated average price. There are two main types: 2. Why Use…

Many beginners think “fundamental analysis” is too complex — something only Wall Street pros can understand. But in reality, it’s like reading a company’s health report — and yes, everyday traders can learn it too. 1. What is Fundamental Analysis?…
1. What is the KDJ Indicator? The KDJ indicator is an extension of the stochastic oscillator (KD indicator), enhanced with an additional J line to make signals more responsive. It is commonly used in Asian markets and gaining popularity among…

When it comes to trading, most people think success depends purely on strategy or technique. In reality, your mindset plays an even bigger role. Many traders lose money not because of a bad setup, but because of one common problem:…
1. What is MACD? The Moving Average Convergence Divergence (MACD) is a trend-following momentum indicator. It shows the relationship between two exponential moving averages (EMAs) of prices. MACD consists of three parts: 2. How to Read MACD? MACD can be…
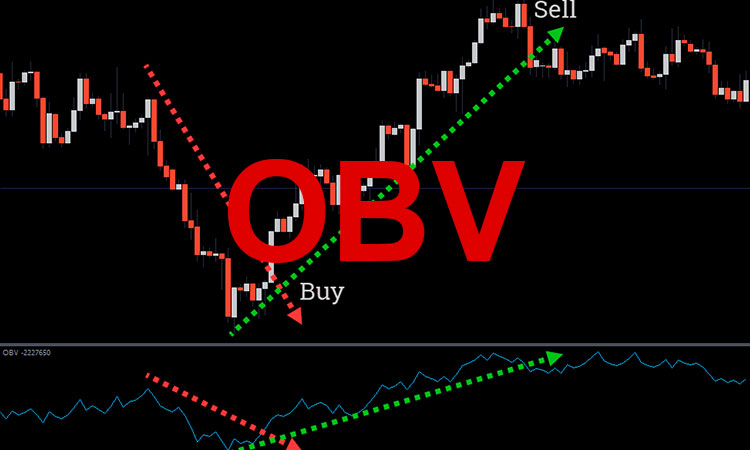
On‑Balance Volume (OBV) uniquely combines price and volume to track buying and selling pressure over time. Developed by Joseph Granville in 1963, OBV adds volume on up days and subtracts on down days to form a cumulative line indicating market…