
Newsletter Subscribe
Enter your email address below and subscribe to our newsletter
Enter your email address below and subscribe to our newsletter
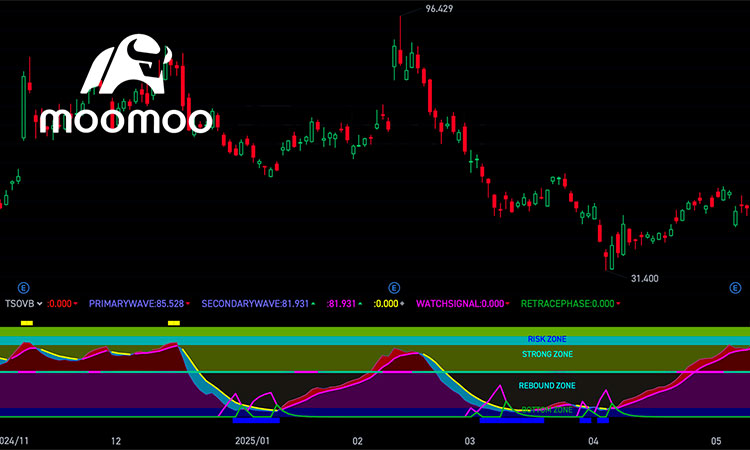
Usage Guide: Basic Trading Rules: Tip: Combine with price action – look for confirmation when both TSOVB signals and actual breakouts/down occur simultaneously. The indicator works best on daily/weekly charts for swing trading. Let’s take a look at this indicator formula:
1. What is the CCI Indicator? The Commodity Channel Index (CCI) is a versatile technical indicator that measures the difference between the current price and its historical average. Though originally designed for commodities, it works well in stocks, indices, and…
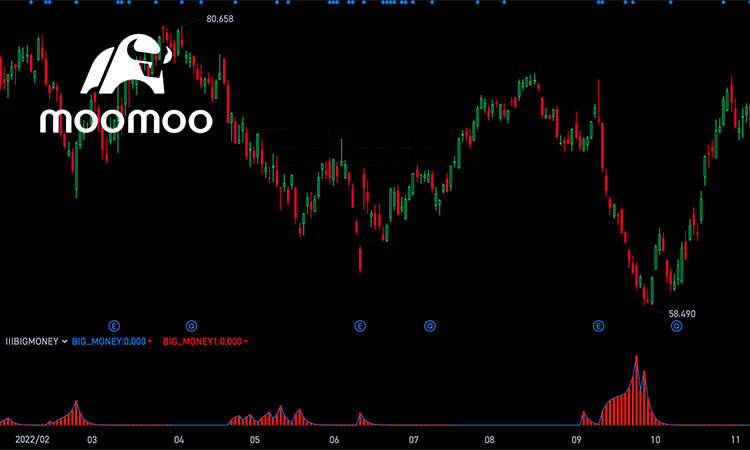
What is the BIG MONEY Indicator? The BIG MONEY Indicator is a custom technical tool designed to detect smart money inflows, i.e., when institutional or large investors quietly accumulate shares at low prices. It uses a combination of long-term high/low…
This is an indicator of Moomoo trading software. Combines price channels, KDJ bottom signals, and RSI overbought alerts for swing trading: Best Used In: Clear trends or range-bound markets; avoid during sideways consolidation. Signal Logic Signal Trigger Action Reduce HH1 > LL1…

This is an indicator of Moomoo trading software. This indicator integrates MACD trend momentum, KDJ overbought/oversold signals, and volume filtering to visually highlight 4 market phases: Operation instructions We can open a position when the bar chart turns yellow, set…
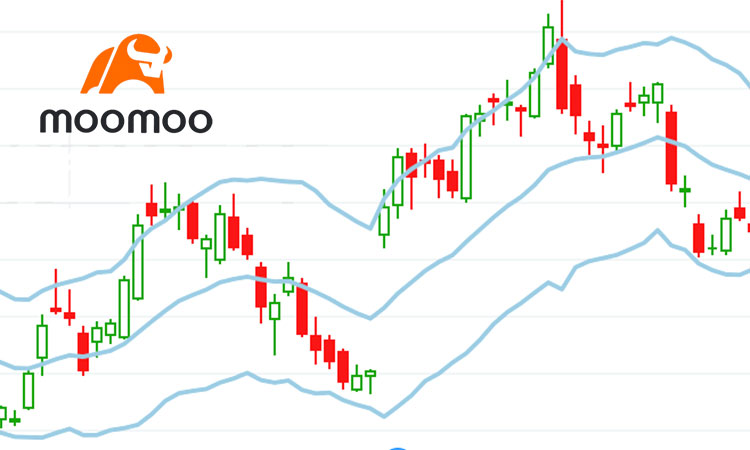
This is an indicator of Moomoo trading software. This volatility-based indicator uses EMA + ATR bands to track trends and reversals: Trading Rules Scenario Signal Action Trend strengthening Price breaks through the upper track (UB) and maintains Go long/hold when price breaks…
This is an indicator of Moomoo trading software. This indicator combines multi-period EMAs (4/6/10/15 days) with a 20-day MA to build a dynamic price channel: Core Logic: Uses multi-EMA smoothing to reduce noise, paired with 20-day MA to filter false…
1. What is RSI? The Relative Strength Index (RSI) is a momentum oscillator that measures the speed and change of price movements. Its values range from 0 to 100, typically used to identify overbought and oversold conditions. Default RSI Setting:…
1. What is a Moving Average? A moving average (MA) is one of the most popular tools in technical analysis. It smooths out price data by creating a constantly updated average price. There are two main types: 2. Why Use…
1. What is the KDJ Indicator? The KDJ indicator is an extension of the stochastic oscillator (KD indicator), enhanced with an additional J line to make signals more responsive. It is commonly used in Asian markets and gaining popularity among…